From the reading desk
Tirzepatide in SURMOUNT: which comparison was tested?
A scientific reading companion on treatment contrasts, symptom groups and the question behind a statistical result.
Clinician medical review has not been completed.
Name the comparison before its result
The paper’s Figure 1 tests compared tirzepatide with placebo, not symptom subgroups.[1]
A significance symbol is an answer to a particular question. Before deciding what it means, name the outcome, the groups being compared, and the difference being tested. A contrast is simply a specified comparison expressed as a quantity. If the outcome is weight change, comparing treatment assignments asks a different question from comparing people classified by symptoms. Those questions can share a page without sharing an answer.
Imagine tracing the endpoints of a comparison with your finger. A test annotation belongs to the pair named by its definition, not automatically to whichever pair appears closest on the page. Moving the annotation would require a new calculation or an explicit statement that the same calculation applies. Visual arrangement helps organize information; it does not supply that statistical connection.
There is also a question about comparisons themselves. A treatment contrast within one group could be compared with a treatment contrast within another. This asks whether the contrasts differ, rather than whether either contrast differs from its own reference value. Keeping these tasks separate makes it possible to read several results together without treating them as interchangeable verdicts.
The useful opening question is therefore narrower than whether a figure looks convincing: what would have to be equal for this particular test's null hypothesis to hold? Answering that identifies what a rejection could challenge. It also identifies what remains outside the test. A result can be informative about its stated comparison while leaving a neighboring comparison open, and recognizing that boundary preserves the information instead of overstating it.
A symptom label is another variable
One nausea/vomiting/diarrhea report defined a nonrandomized symptom subgroup.[1]
Treatment assignment and later classification occupy different places in an argument. An assignment rule can determine who receives a strategy. A classification rule can sort records according to what is subsequently observed. If a reader wants to compare those resulting groups, the reason their members came together matters. The treatment allocation alone cannot establish that a later sorting rule preserved comparable groups.
Consider a classification that could depend both on treatment and on other features associated with an outcome. Restricting attention to one category could then select different mixtures of those features from the treatment arms. A comparison inside that category would need to account for how the category was formed. Calling the original allocation randomized would not, by itself, resolve the selection introduced by the additional condition.
The content of a label matters separately from its origin. A yes-or-no category records whether its criterion was met. It cannot, without further information, distinguish an early report from a late report, a brief experience from a prolonged one, or a lower intensity from a higher intensity. If several types of report qualify, membership alone also cannot identify which type occurred. Each additional question needs a corresponding variable.
These distinctions change the quantity a reader should request. A difference between classified groups would describe an outcome conditional on that classification. A comparison of treatment contrasts across those groups would address a further statistical question. An account of why the groups differ would require still more reasoning. The labels need not be discarded; they need to remain attached to the particular task they can support, with their definition and timing visible.
What the two plotted numbers can support
SURMOUNT-1 randomized adults with obesity or overweight without diabetes to weekly subcutaneous tirzepatide or placebo; the primary treatment period lasted 72 weeks.[2]
Read an occurrence display by first deciding what earns a place in its numerator and denominator. For a percentage of people meeting a criterion, repeated occurrences in the same person cannot simply be added as extra people. The denominator must describe the population eligible for that numerator. Starting from this relationship prevents a percentage from quietly becoming a count of episodes or a measure of time spent with an experience.
A named symptom and a broader collection of symptoms are also different endpoints. Expanding the category would require deciding which additional reports qualify and how overlapping reports are handled. The resulting numerator could not be recovered merely by changing the heading. This is a question about what is measured, before it is a question about which group has a larger value.
To connect an occurrence comparison with weight change, an analyst would need observations linking the two outcomes for the relevant people and periods. Separate summaries would not establish their joint pattern. Even with linked records, the analyst would still need to choose whether to describe association, compare treatment effects, or examine a proposed explanation. Those choices determine the calculation rather than following from the appearance of the bars.
Precision requires another layer of information. To assess uncertainty in an occurrence contrast, the calculation would need the eligible denominators and the assumptions governing the observations. Rounded percentages alone would not specify that calculation. Nor would extra decimal places establish practical importance. The measurement, its uncertainty, and the reason a difference matters are separate parts of an interpretation.
A defined comparison
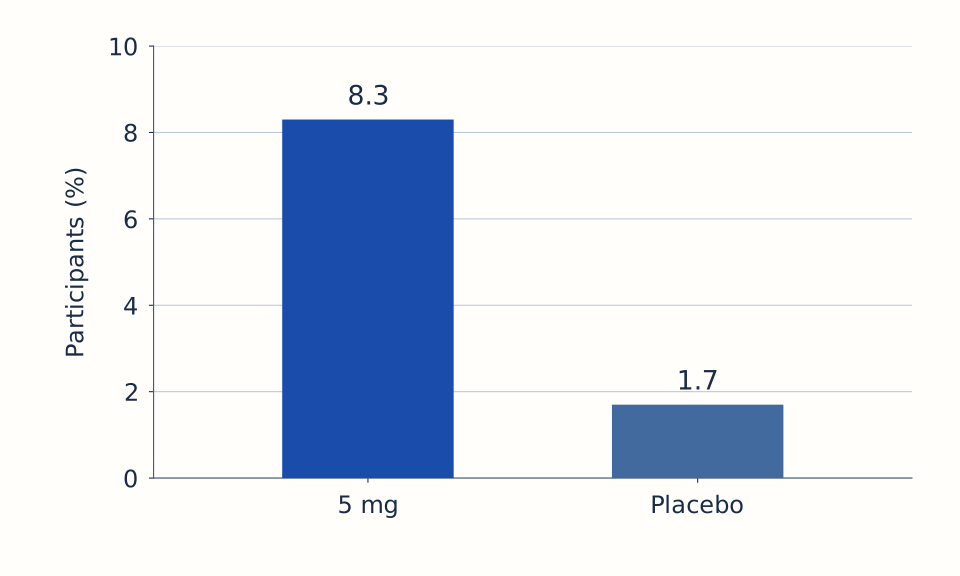
Open the chart’s data table
| Arm | Participants (%) |
|---|---|
| 5 mg | 8.3 |
| Placebo | 1.7 |
Comparing two contrasts requires its own test
Testing each effect against a reference value and testing their difference are different mathematical operations. The first asks whether an individual effect is compatible with that reference under a stated model. The second asks whether the effects are compatible with each other. The uncertainty attached to an effect is not automatically the uncertainty attached to a difference between effects.
This explains why two significance labels cannot answer an interaction question. Both effects could receive the same label while differing in magnitude. They could receive different labels even when their estimated difference is compatible with no difference. The labels compress each estimate together with its uncertainty into a decision. Comparing the decisions throws away information needed to compare the estimates themselves.
A direct comparison should therefore begin by constructing the contrast of interest. For treatment differences across symptom categories, that could mean subtracting one treatment-to-reference contrast from the other on a specified outcome scale. The next step would be to estimate uncertainty for that constructed quantity. Only then could a test address the intended question about differences between contrasts.
Dependence matters in that calculation. If estimates share a comparator or draw on related observations, their errors cannot simply be assumed independent. Combining their separate uncertainty summaries without the relationship between them could misstate uncertainty for the difference. An analyst needs to account for which observations contribute to both estimates, rather than treating the displayed summaries as if they came from unrelated calculations.
The scale also belongs in the question. Equality of absolute differences and equality of relative differences impose different conditions. A conclusion about interaction on one scale would not automatically establish the same conclusion on another. The choice should follow the scientific purpose, with the resulting interpretation stated on that scale. A dedicated contrast can sharpen the answer while still leaving the origin of any group difference unresolved.
The records behind an estimate
Analyses excluded post-discontinuation data and, in SURMOUNT-2, post-antihyperglycemic-rescue measurements.[1]
A comparison is calculated from records admitted by an analysis rule. To understand the answer, distinguish that rule from a claim about everyone who entered an investigation. A data set might contain multiple measurements for each person. A rule applied to measurements could retain some observations from a person while omitting others. Describing it only as a rule about participants would lose that distinction.
The next issue is whether the admission rule could be related to the outcome. If record availability depends on circumstances associated with later change, the available observations might represent a selected pattern. That possibility calls for examination; it does not dictate the direction of a difference. An explanation would need to connect the selection process with the outcome rather than assuming that every exclusion creates the same distortion.
Careful specification and recovery of information are separate achievements. An analyst can define a target clearly without having every observation needed to estimate it. A method might then rely on assumptions about unavailable measurements. Making those assumptions explicit lets a reader distinguish what was recorded from what the calculation requires. Precision within the chosen model would not automatically measure uncertainty about whether its assumptions hold.
A useful sensitivity exercise would vary a consequential assumption while holding the scientific target steady. If the interpretation changed, the report could identify which assumption carried that change. If it remained similar, the reassurance would concern the alternatives actually examined. Neither outcome would justify declaring all possible missing-record processes harmless.
The companion analysis offers another place to practice identifying the records a claim needs. When reading across analyses, keep the admission rule beside the outcome and comparator. A difference in available records may require a different interpretation even when the displayed outcome uses the same units.
Replication needs the same question
SURMOUNT-4 combined a 36-week open-label lead-in with 52 randomized weeks, totaling 88 weeks.[2]
A treatment-start question and a continuation question place their decision points differently. The first can ask about assigning a strategy from an initial starting condition. The second can ask about the next choice after a prior course of experience. Before comparing answers, identify the condition at which each decision is made. The shared name of a treatment would not make those conditions identical.
If eligibility for a later comparison depends on what happened earlier, that eligibility becomes part of the population being studied. A later randomized choice could support a comparison within that population. It would not erase the earlier conditions used to reach it. To extend an interpretation to another starting population, an argument would need to explain why those conditions do not undermine the proposed connection.
This creates two distinct meanings of difference across investigations. The estimates might differ because the same question receives different answers. Alternatively, the investigations might address different questions because their starting conditions, strategies, or endpoints differ. Those possibilities should be separated before using a statistical summary to describe inconsistency. Numerical similarity would not settle the distinction either.
Replication can still have value when protocols are not identical. The report should state what proposition is being checked again and which changes are allowed without changing that proposition. A repeated direction might support a broad pattern while remaining insufficient to establish the same magnitude. Conversely, a changed result could prompt examination of a changed condition before being called a contradiction. This approach makes replication a comparison of defined scientific commitments, rather than a tally of familiar treatment names or significance symbols.
Precision is part of the claim
ICH distinguishes the treatment effect of interest from the method used to estimate it.[3]
A target should be understandable before a particular computation is chosen. Once it is stated, an estimator is a rule for producing an answer from observations, and an estimate is the value obtained. Uncertainty describes how much that answer could vary under the chosen framework and assumptions. Interpretation asks what the answer means for the original question. Improving one step does not automatically repair a mismatch at another.
A small probability calculated under a null model is not the probability that the null claim is true. The calculation starts by assuming that model and asks about results at least as extreme as the observed result, according to the test. Reversing the direction would require a different inferential framework and additional assumptions. The distinction matters because a test result should not be translated directly into a personal certainty about an explanation.
Equivalence asks for a more specific commitment than failure to detect a difference. A suitable analysis would need a justified margin defining differences small enough for the stated purpose, along with a design and uncertainty calculation capable of assessing that margin. The margin should not be chosen merely because it happens to fit the observed estimates.
If an interval includes both negligible and consequential differences, a no-difference result would leave an important ambiguity. Visual proximity between plotted estimates could not resolve it. An equivalence argument would instead examine whether the appropriate uncertainty region fits within the justified bounds. Even then, the conclusion would concern the specified margin, outcome, population, and assumptions; it would not establish literal identity or agreement on every possible outcome.
A result that can be checked
Lilly-funded; six authors disclosed Lilly employment and shareholding.[1]
A checkable report would put the statistical question beside its answer. For each result, it could state the contrast, outcome scale, admitted observations, estimation method, and uncertainty. It could also distinguish a question specified before inspecting the results from a question developed during exploration. This would let another reader reconstruct what was tested without having to infer the comparison from the arrangement of a figure.
The report could make alternative analytical choices inspectable as well. Which decision changes the target, and which changes the method for estimating the same target? That distinction would help organize sensitivity analyses. A disagreement about the desired question would not be settled merely by rerunning a calculation, while a disagreement about computation could be examined without silently replacing the question.
A separately specified interaction analysis could estimate how a treatment contrast differs across defined categories on a chosen scale. It could show the contrast's uncertainty and how that uncertainty was calculated. If category membership depended on later observations, however, this additional calculation would not transform those categories into assigned interventions. Statistical clarity and causal identification would remain separate requirements.
These are proposals for making an argument examinable, not claims that a particular document lacks them. The editorial policy provides the publication's own reading context. A disclosure can inform scrutiny, but neither acceptance nor rejection of a scientific result should substitute for following the steps from the defined question to the reported answer.
Current safety and reading scope
Zepbound is contraindicated with personal or family medullary thyroid carcinoma history, multiple endocrine neoplasia type 2, or prior serious hypersensitivity to tirzepatide or product ingredients. Use is not recommended with severe gastroparesis. Persistent or severe abdominal pain needs prompt assessment; gastrointestinal fluid loss can injure kidneys. Gastric emptying is delayed.[4]
Compounded GLP-1 products are not FDA-approved.[5]
The reference entry keeps a shorter record available alongside this article. Questions about a personal situation belong in a clinical discussion, with the actual product and circumstances identified. A statistical comparison cannot resolve that discussion by supplying a significance symbol or a group label.
A service review is a route to dated provider documentation, not an extension of a trial comparison. Provider claims need their own supporting records. Keeping those documents separate prevents the authority of a scientific result from being transferred to a service claim it was never designed to answer.
Reader questions
Does significance in both groups prove their effects are equal?
Not by itself. A significance decision against a reference value does not estimate the difference between the group effects. Equality, interaction, and equivalence need their own clearly stated comparisons. An equivalence argument would also need an appropriate margin and uncertainty assessment. The useful request is for the contrast that answers the intended question, rather than a comparison of the symbols attached to separate tests.
Can a symptom percentage answer a weight-change question?
No. An occurrence percentage and a change in weight describe different quantities. Examining a connection would require records that link the outcomes for relevant people and periods, together with a defined comparison. Separate summaries cannot supply that joint information. Even a linked association would leave open whether other features account for the pattern; it would not turn the symptom into an assigned cause.
What would make a comparison easier to verify?
A report is easier to verify when it identifies the comparison, the records admitted, and the calculation used to express uncertainty. Another analyst could then check whether the method answers the stated question and explore consequential assumptions. That transparency would make disagreement more precise. It would not, by itself, establish a mechanism or remove the need to examine how the compared groups were formed.
Assessment
A statistical claim is most useful when its comparison stays attached to its measurement and admitted records. The reader can then distinguish a treatment effect, a difference between symptom categories, and a difference between treatment contrasts. Those are related questions, but each needs its own quantity and uncertainty. A productive next analysis would specify the desired contrast in advance, justify its scale, and show how the observations support its estimation. Where a claim concerns similarity, it would also need to define how close is close enough for that purpose. These steps could make a result more decisive about a narrowly stated question. They would still not turn a later classification into an assigned exposure or explain why a pattern arose. Keeping that separation makes scientific progress possible without asking a statistical answer to carry a causal conclusion it has not established.
Reading scope
This article explains how to identify and interpret statistical comparisons. It does not provide an individual prediction, a complete prescribing guide, or a recommendation about a provider. Its general reasoning illustrates questions to ask of an analysis; it does not supply new calculations or establish unreported relationships.